
HARNESS proprietary research into trends in transaction values in England and Wales
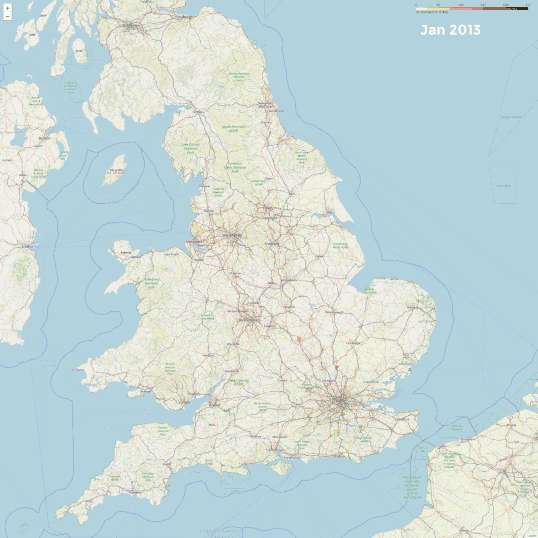
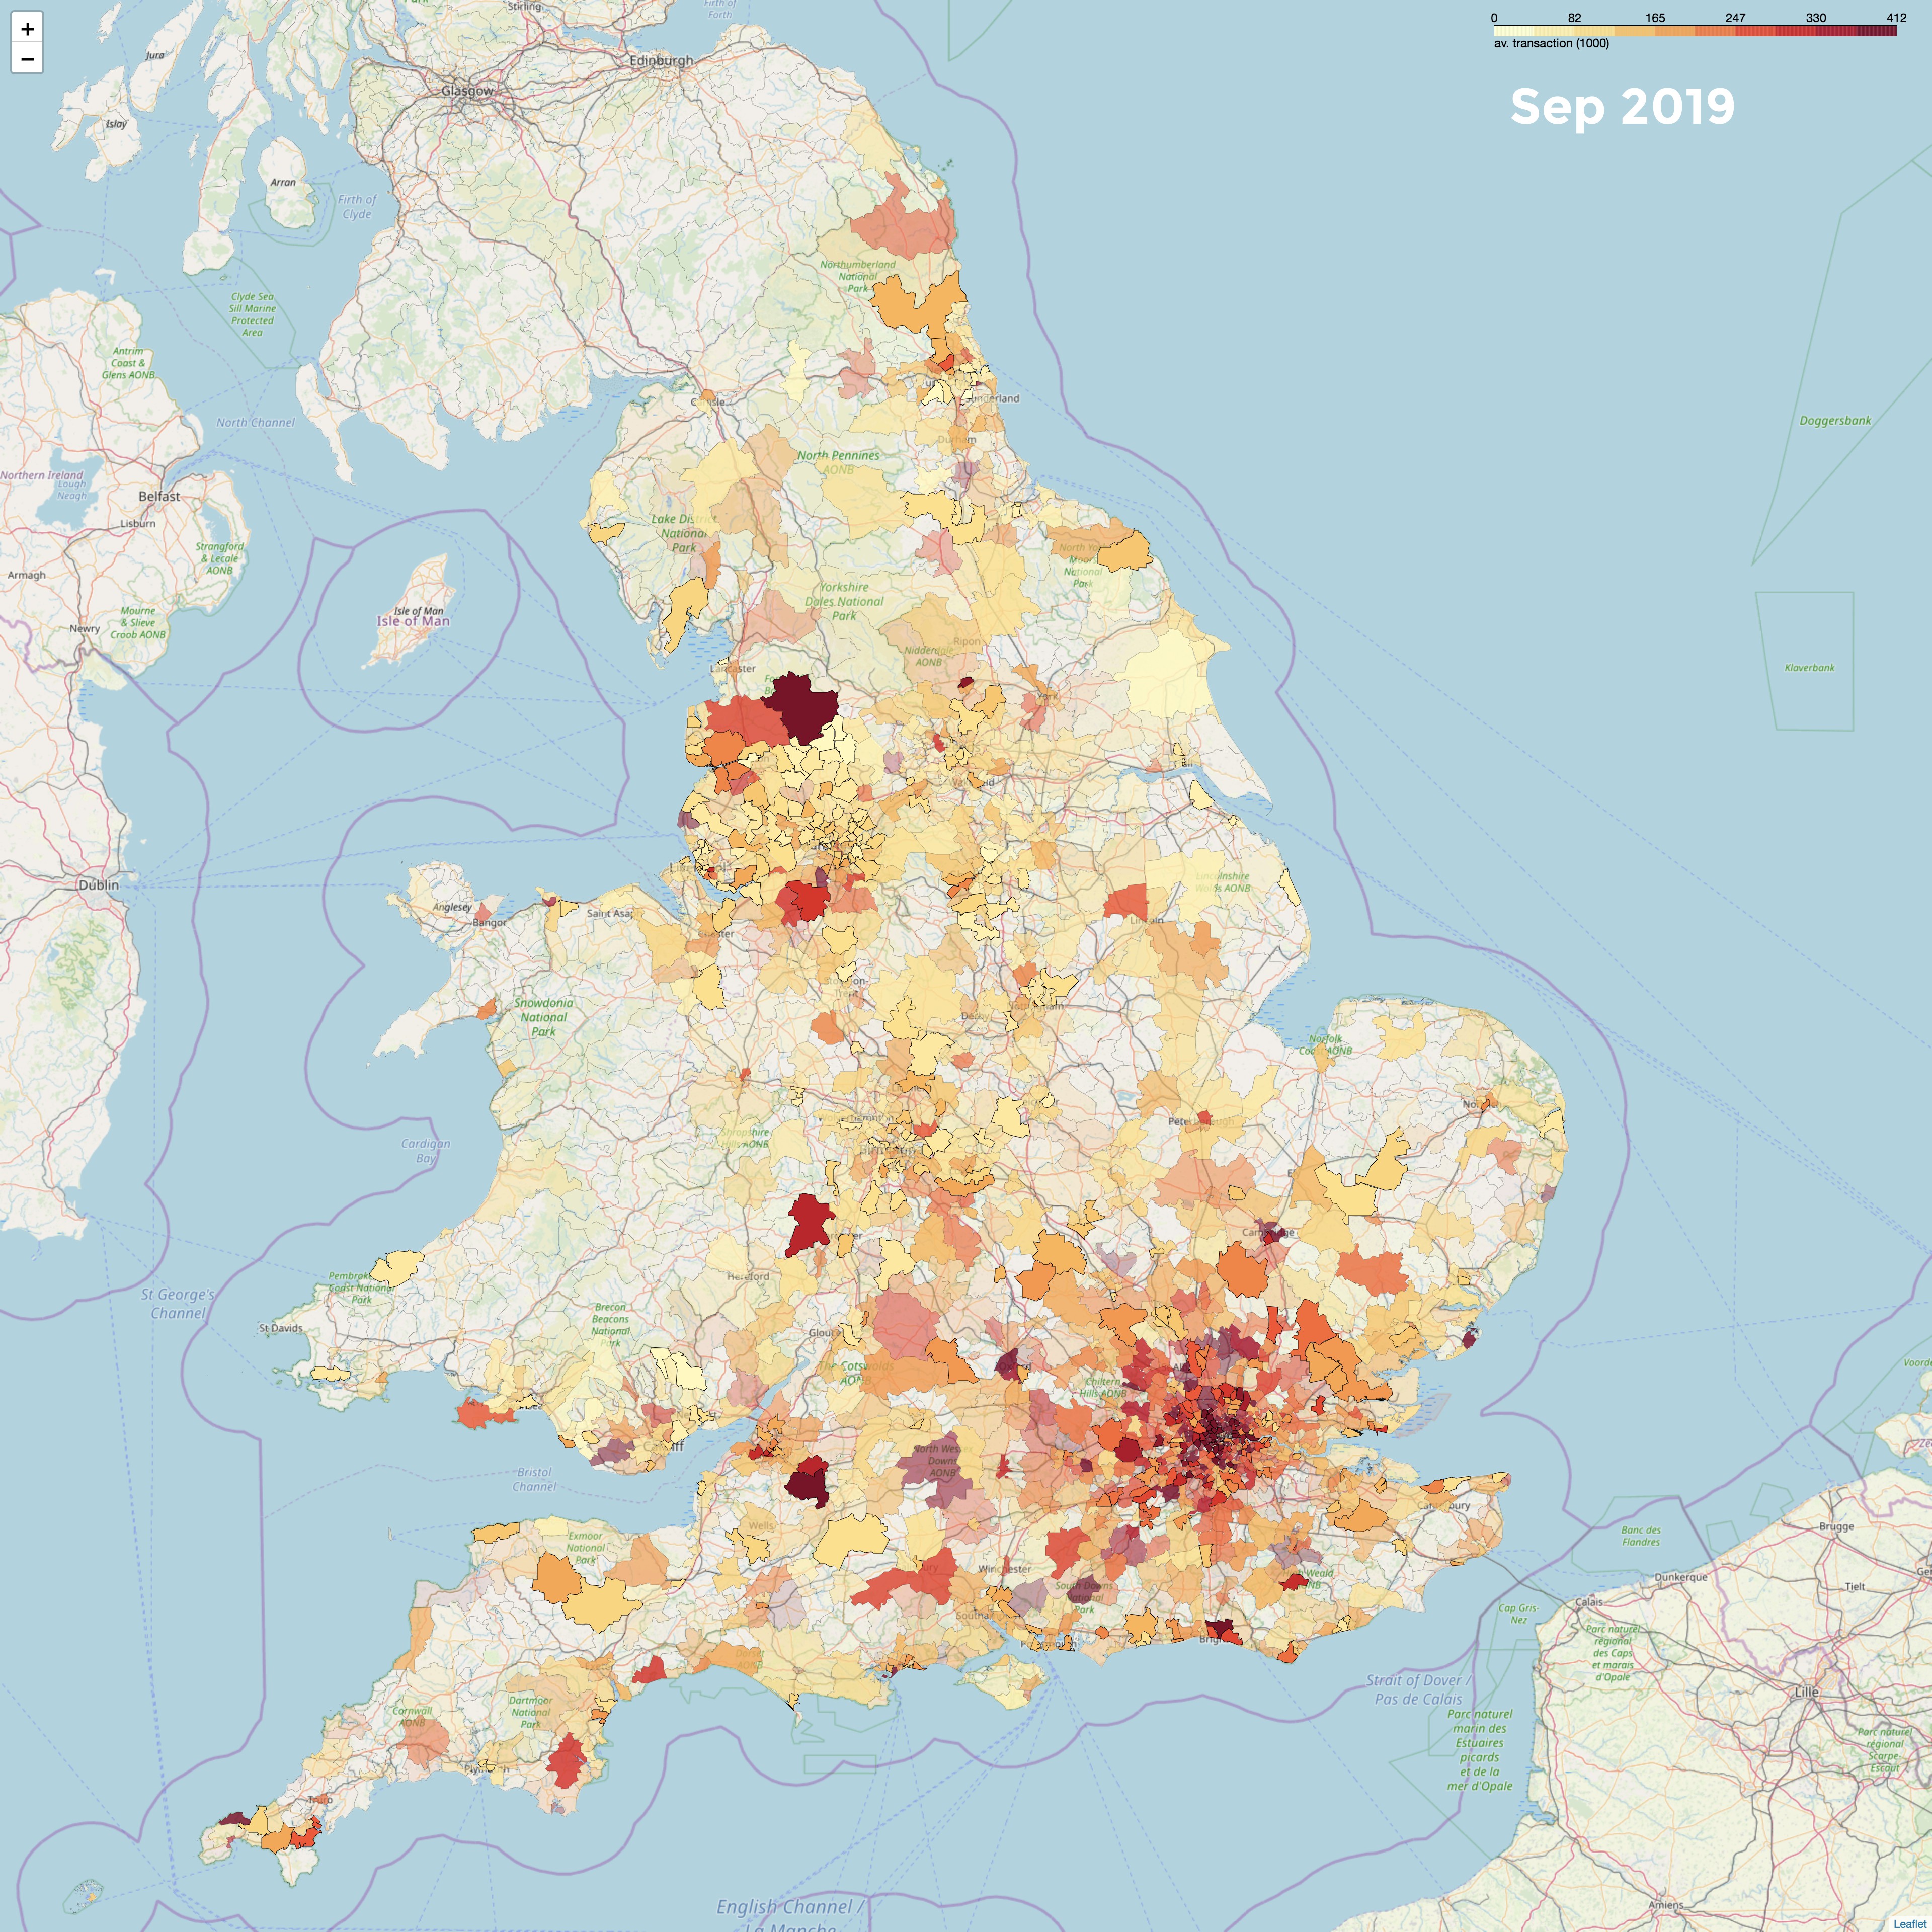
The HARNESS data science team plotted average commercial lease transaction values across England and Wales, broken down by postcode district from January 2013, right through to September 2019. The data tells an interesting story of changing fortunes and recovery of commercial real estate in different regions over the last few years.
AVERAGE MONTHLY TRANSACTION VALUES
WHAT METHODOLOGY DID WE USE?
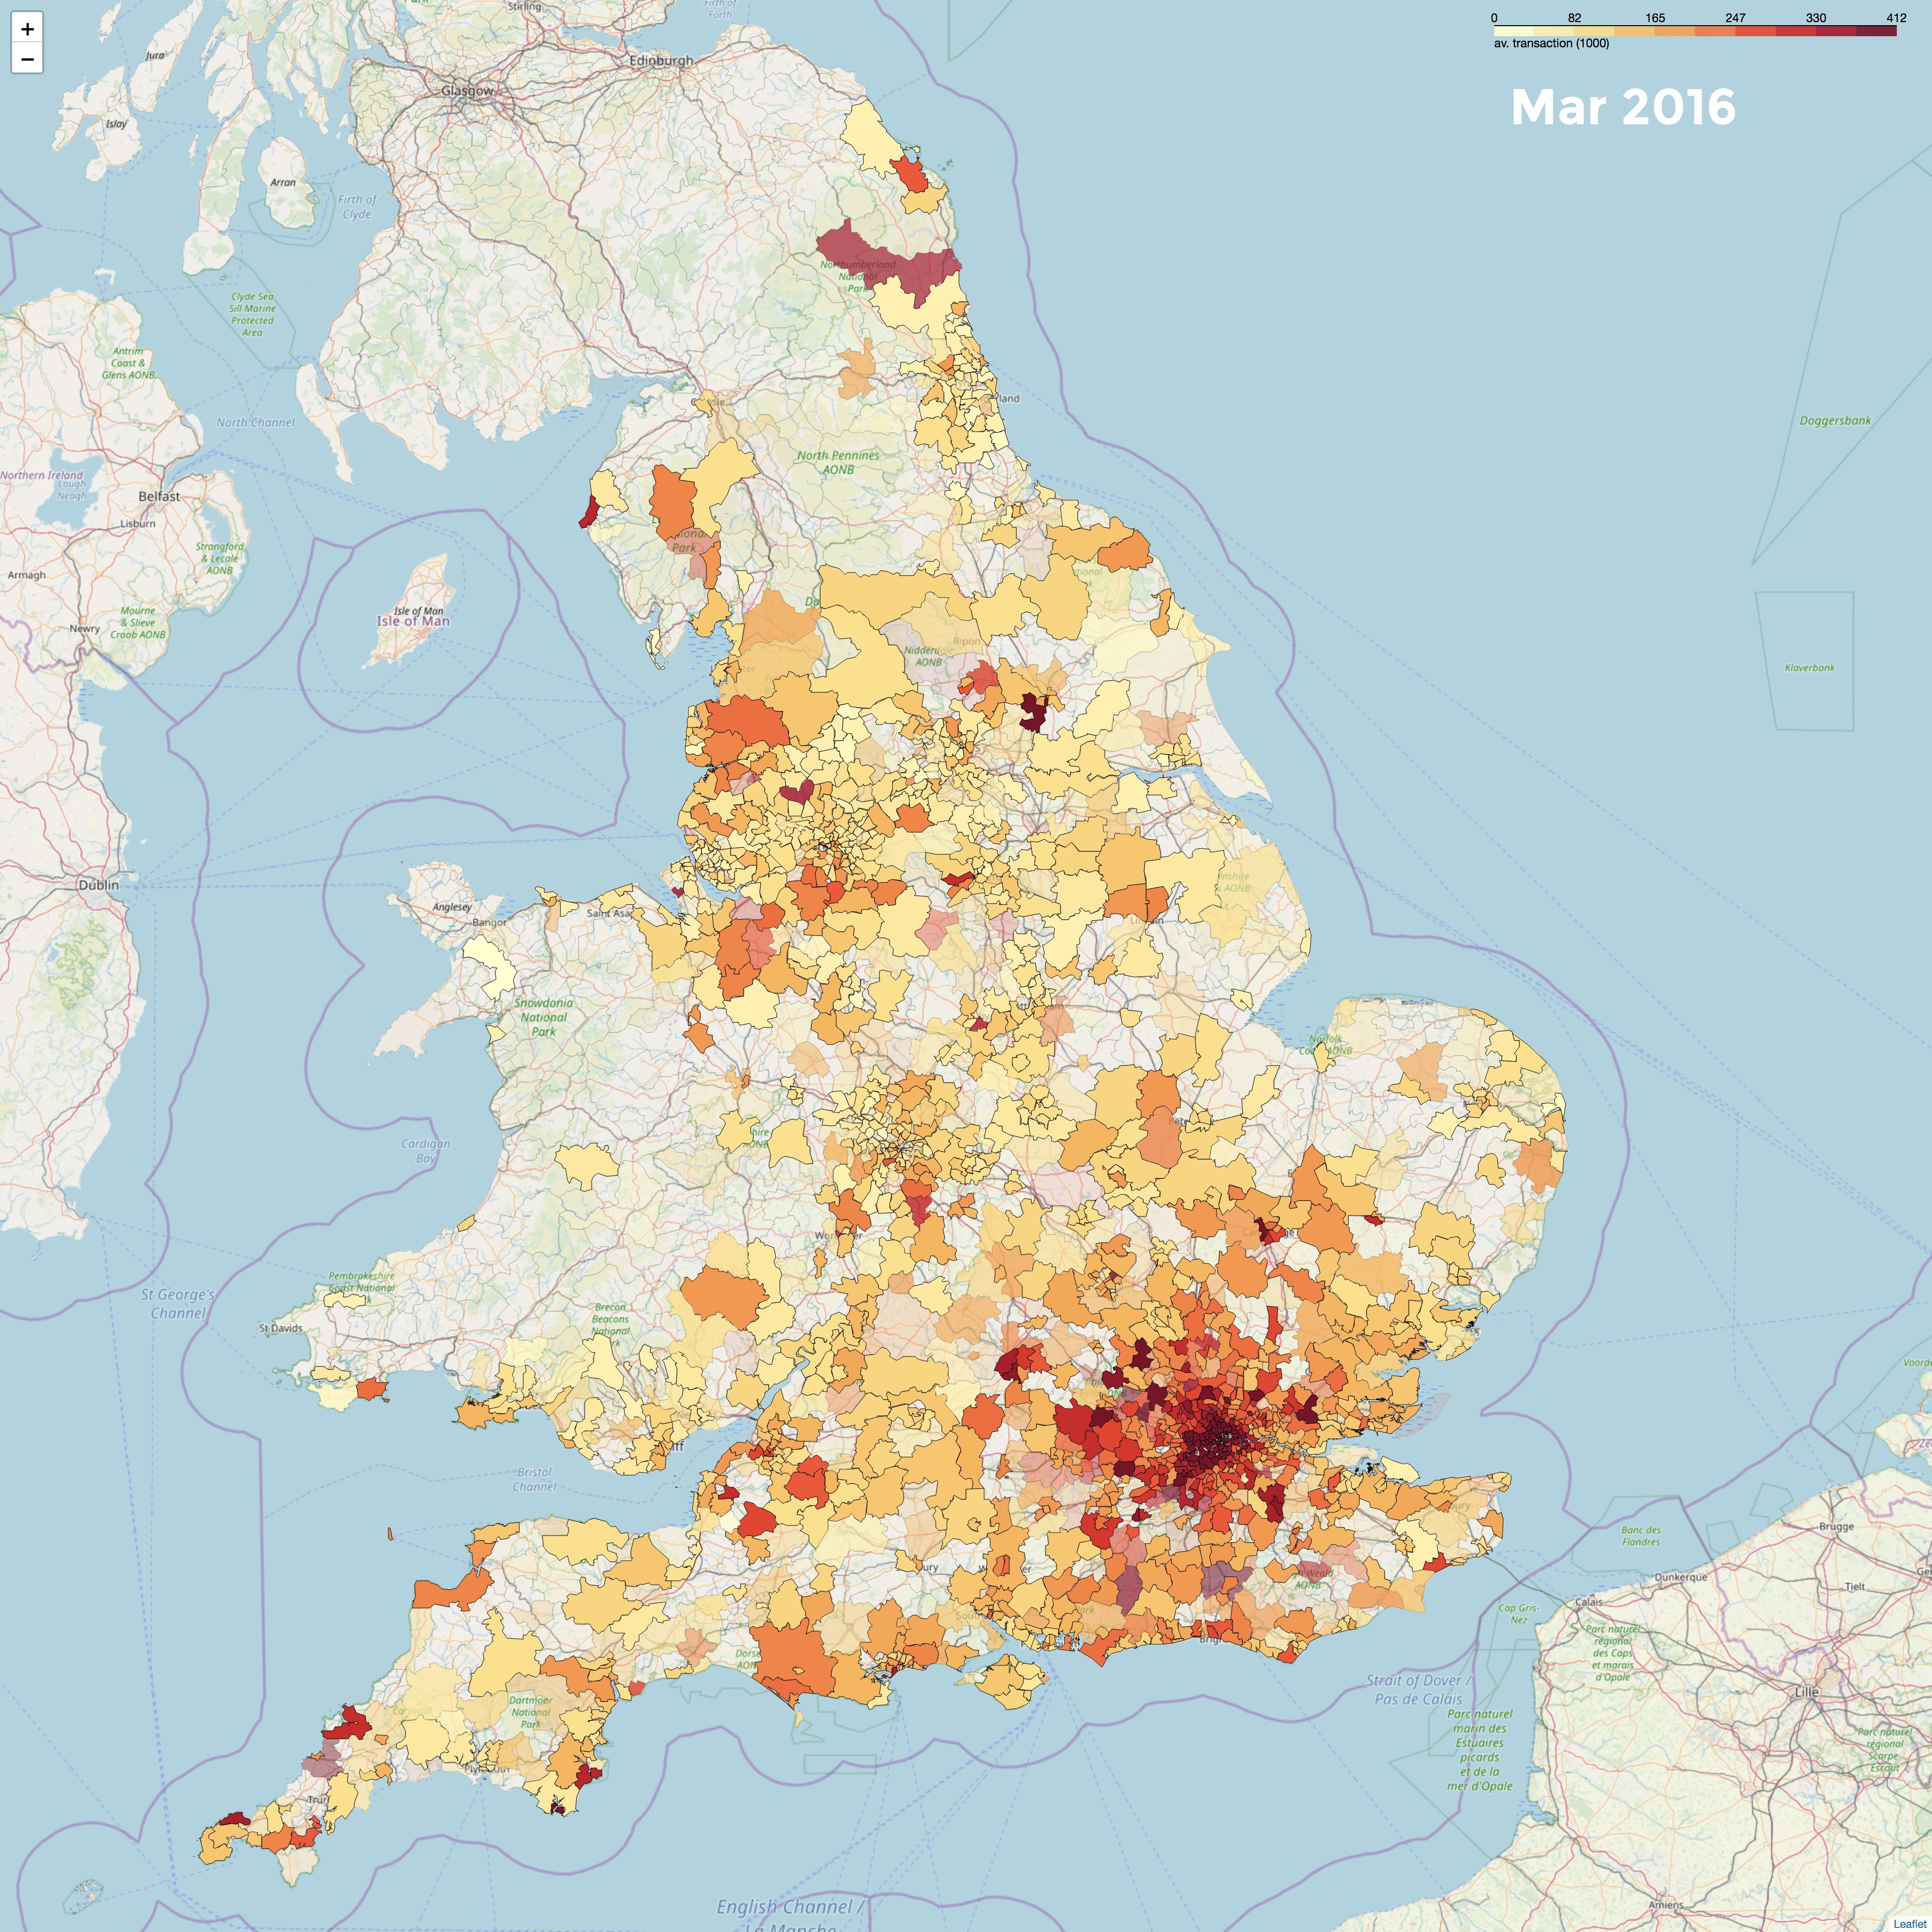
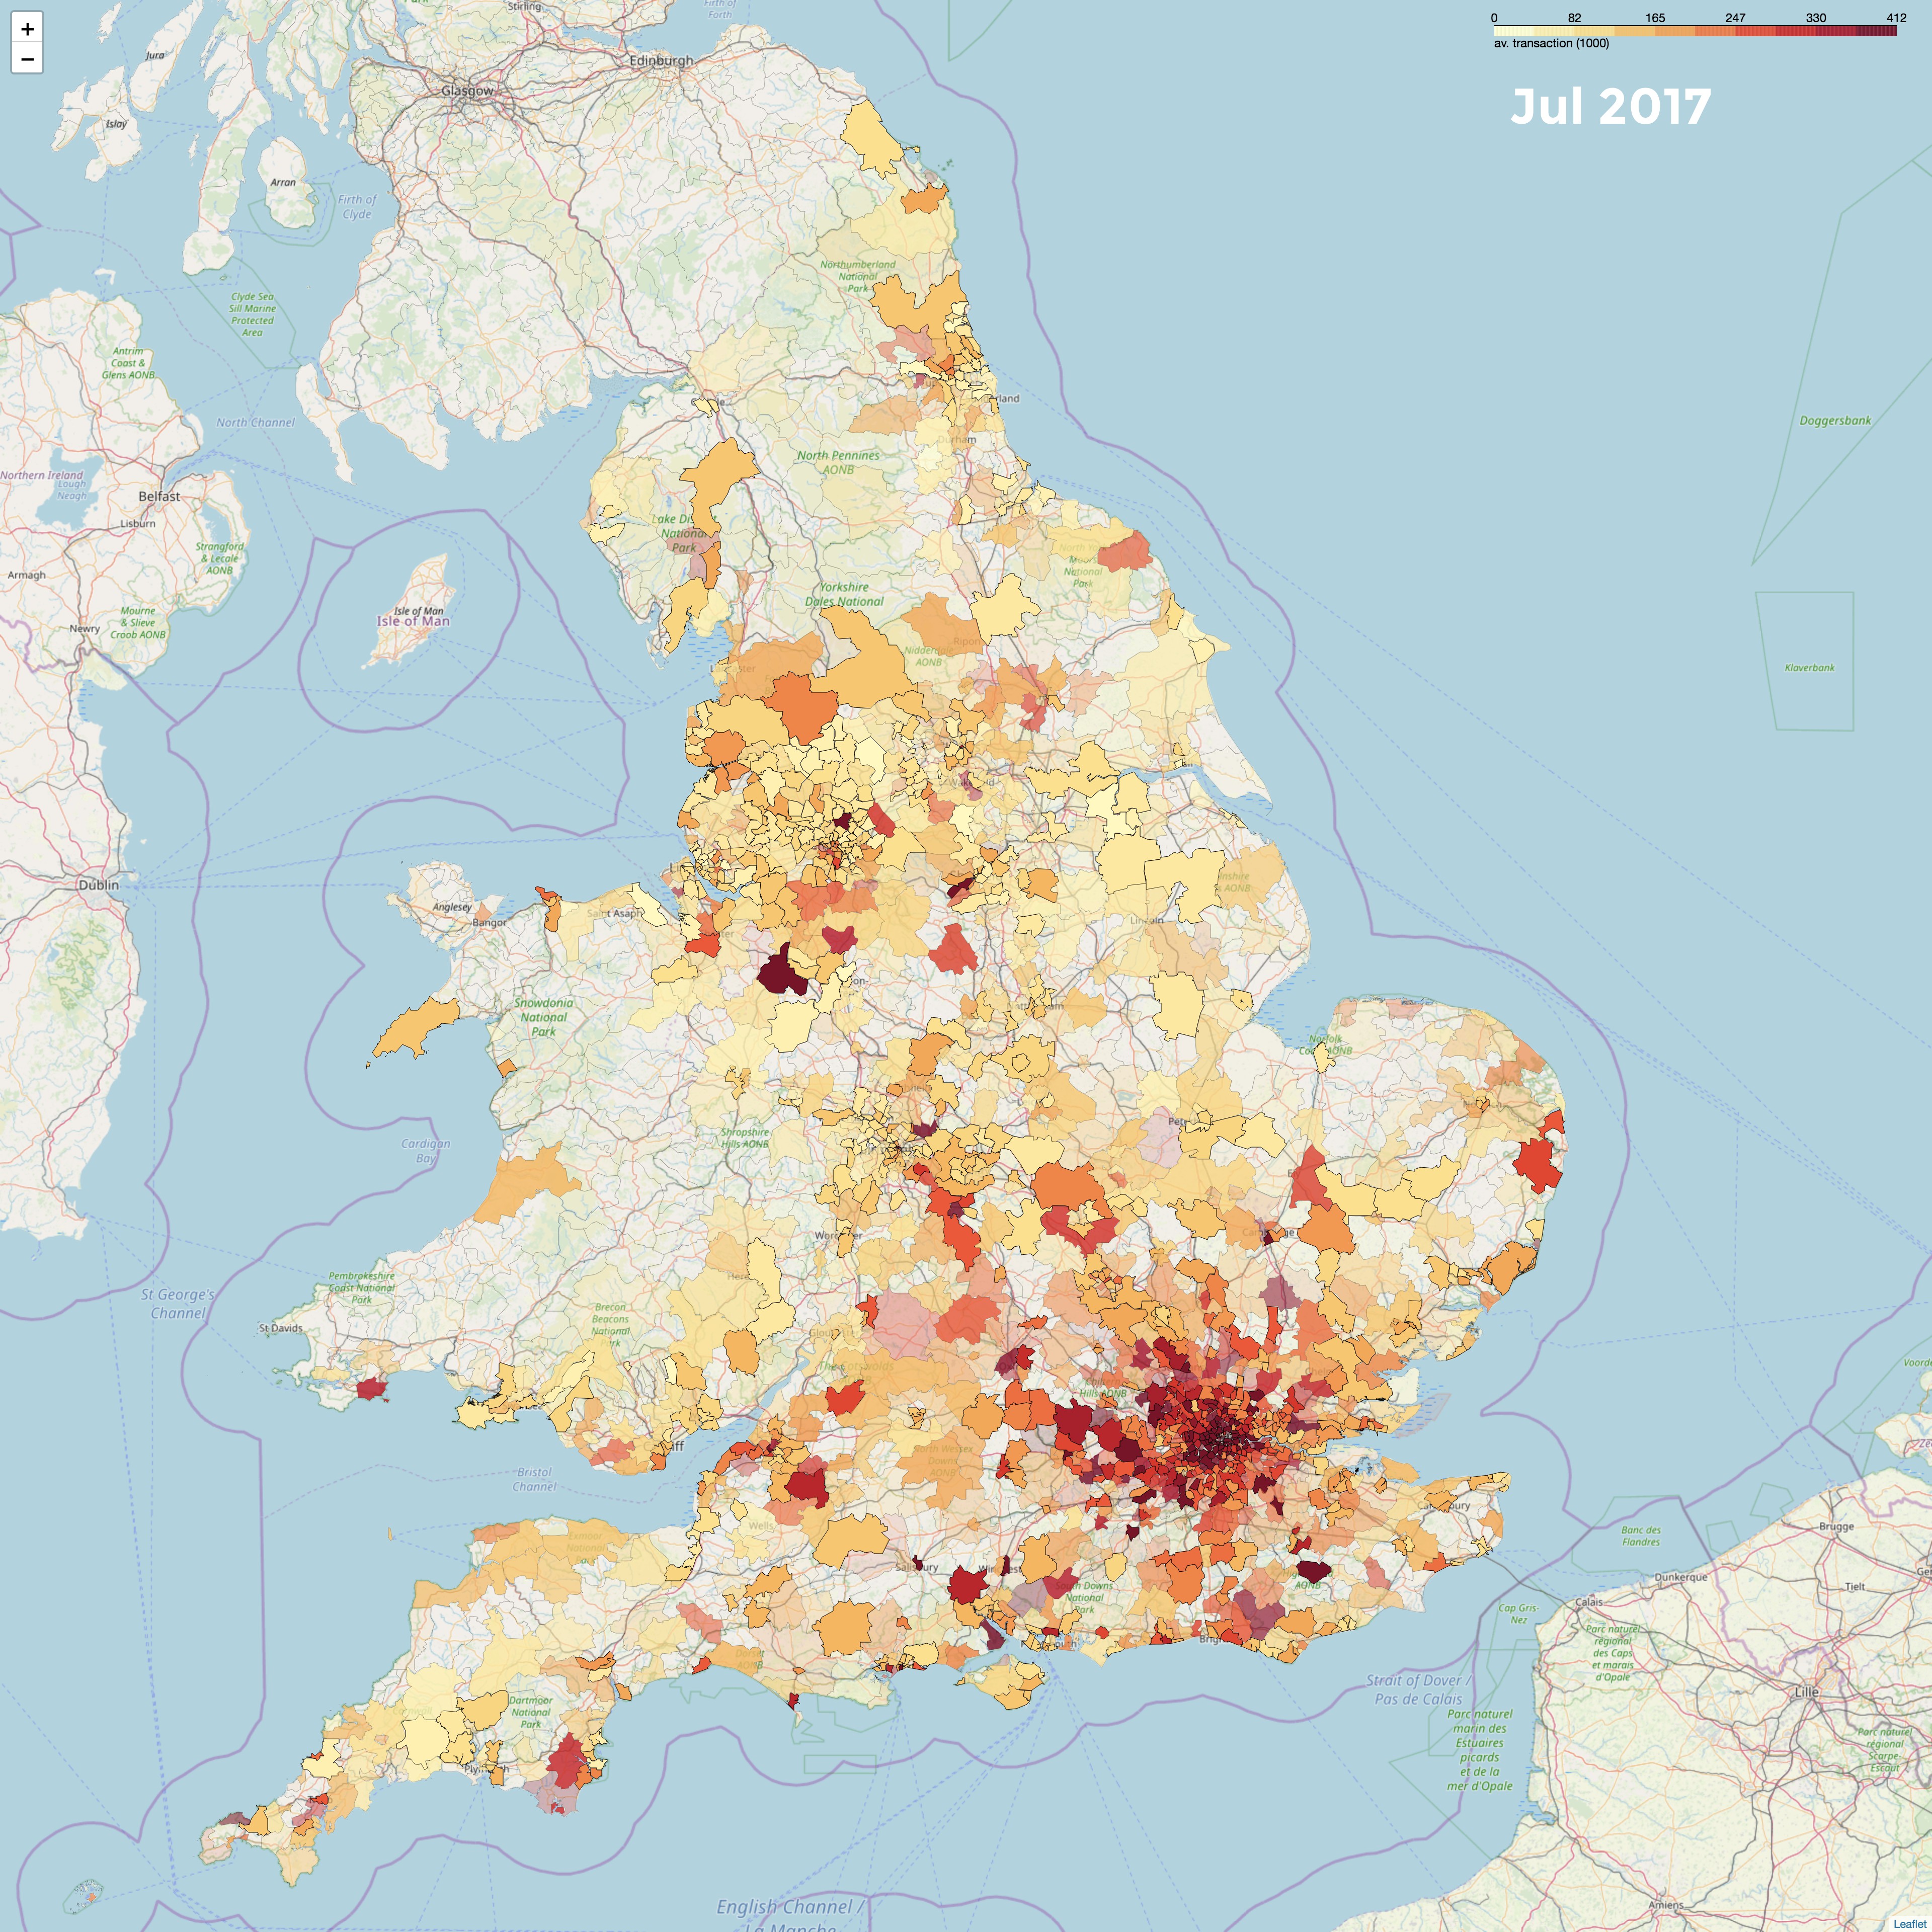
The team took all the available Land Registry CRE data and averaged the transaction values each month in each postcode district. For consistency they only included lease data, which is recorded by Land Registry whenever a property is transacted with a lease term of 7 years or longer. All commercial asset classes are included. The average transaction value per area was then plotted on the map, and animated to show the years passing by. The darker an area, the higher its average transaction value.
It’s worth noting that CRE Land Registry data took a couple of years to attain full coverage in England and Wales, so the map may appear sparse in the early years, but coverage ramps up from 2014 onwards. In some instances transactions may not be recorded every month, so if transactions happened one month but not the following we assume the average value stayed the same to keep the continuity.
Additionally average values do not take into account the overall values of property in the area, and price per square metre is not calculated, meaning the property size is ignored. By averaging the transactions over a large postcode area some of the idiosyncrasies are removed, but the irregular frequency of transactions may reintroduce some volatility.
WHAT CAN WE LEARN FROM THE DATA?
The data shows that after the 2010 property market crash the north of England was affected for much longer, whereas London recovered more quickly and transaction values have been much more steady for a longer period of time. What we see is a stable period of recovery up to 2016 across all asset classes, and afterwards there’s a general lack of movement due to Brexit uncertainty.
Let’s look at a few snapshots of data from over the period.
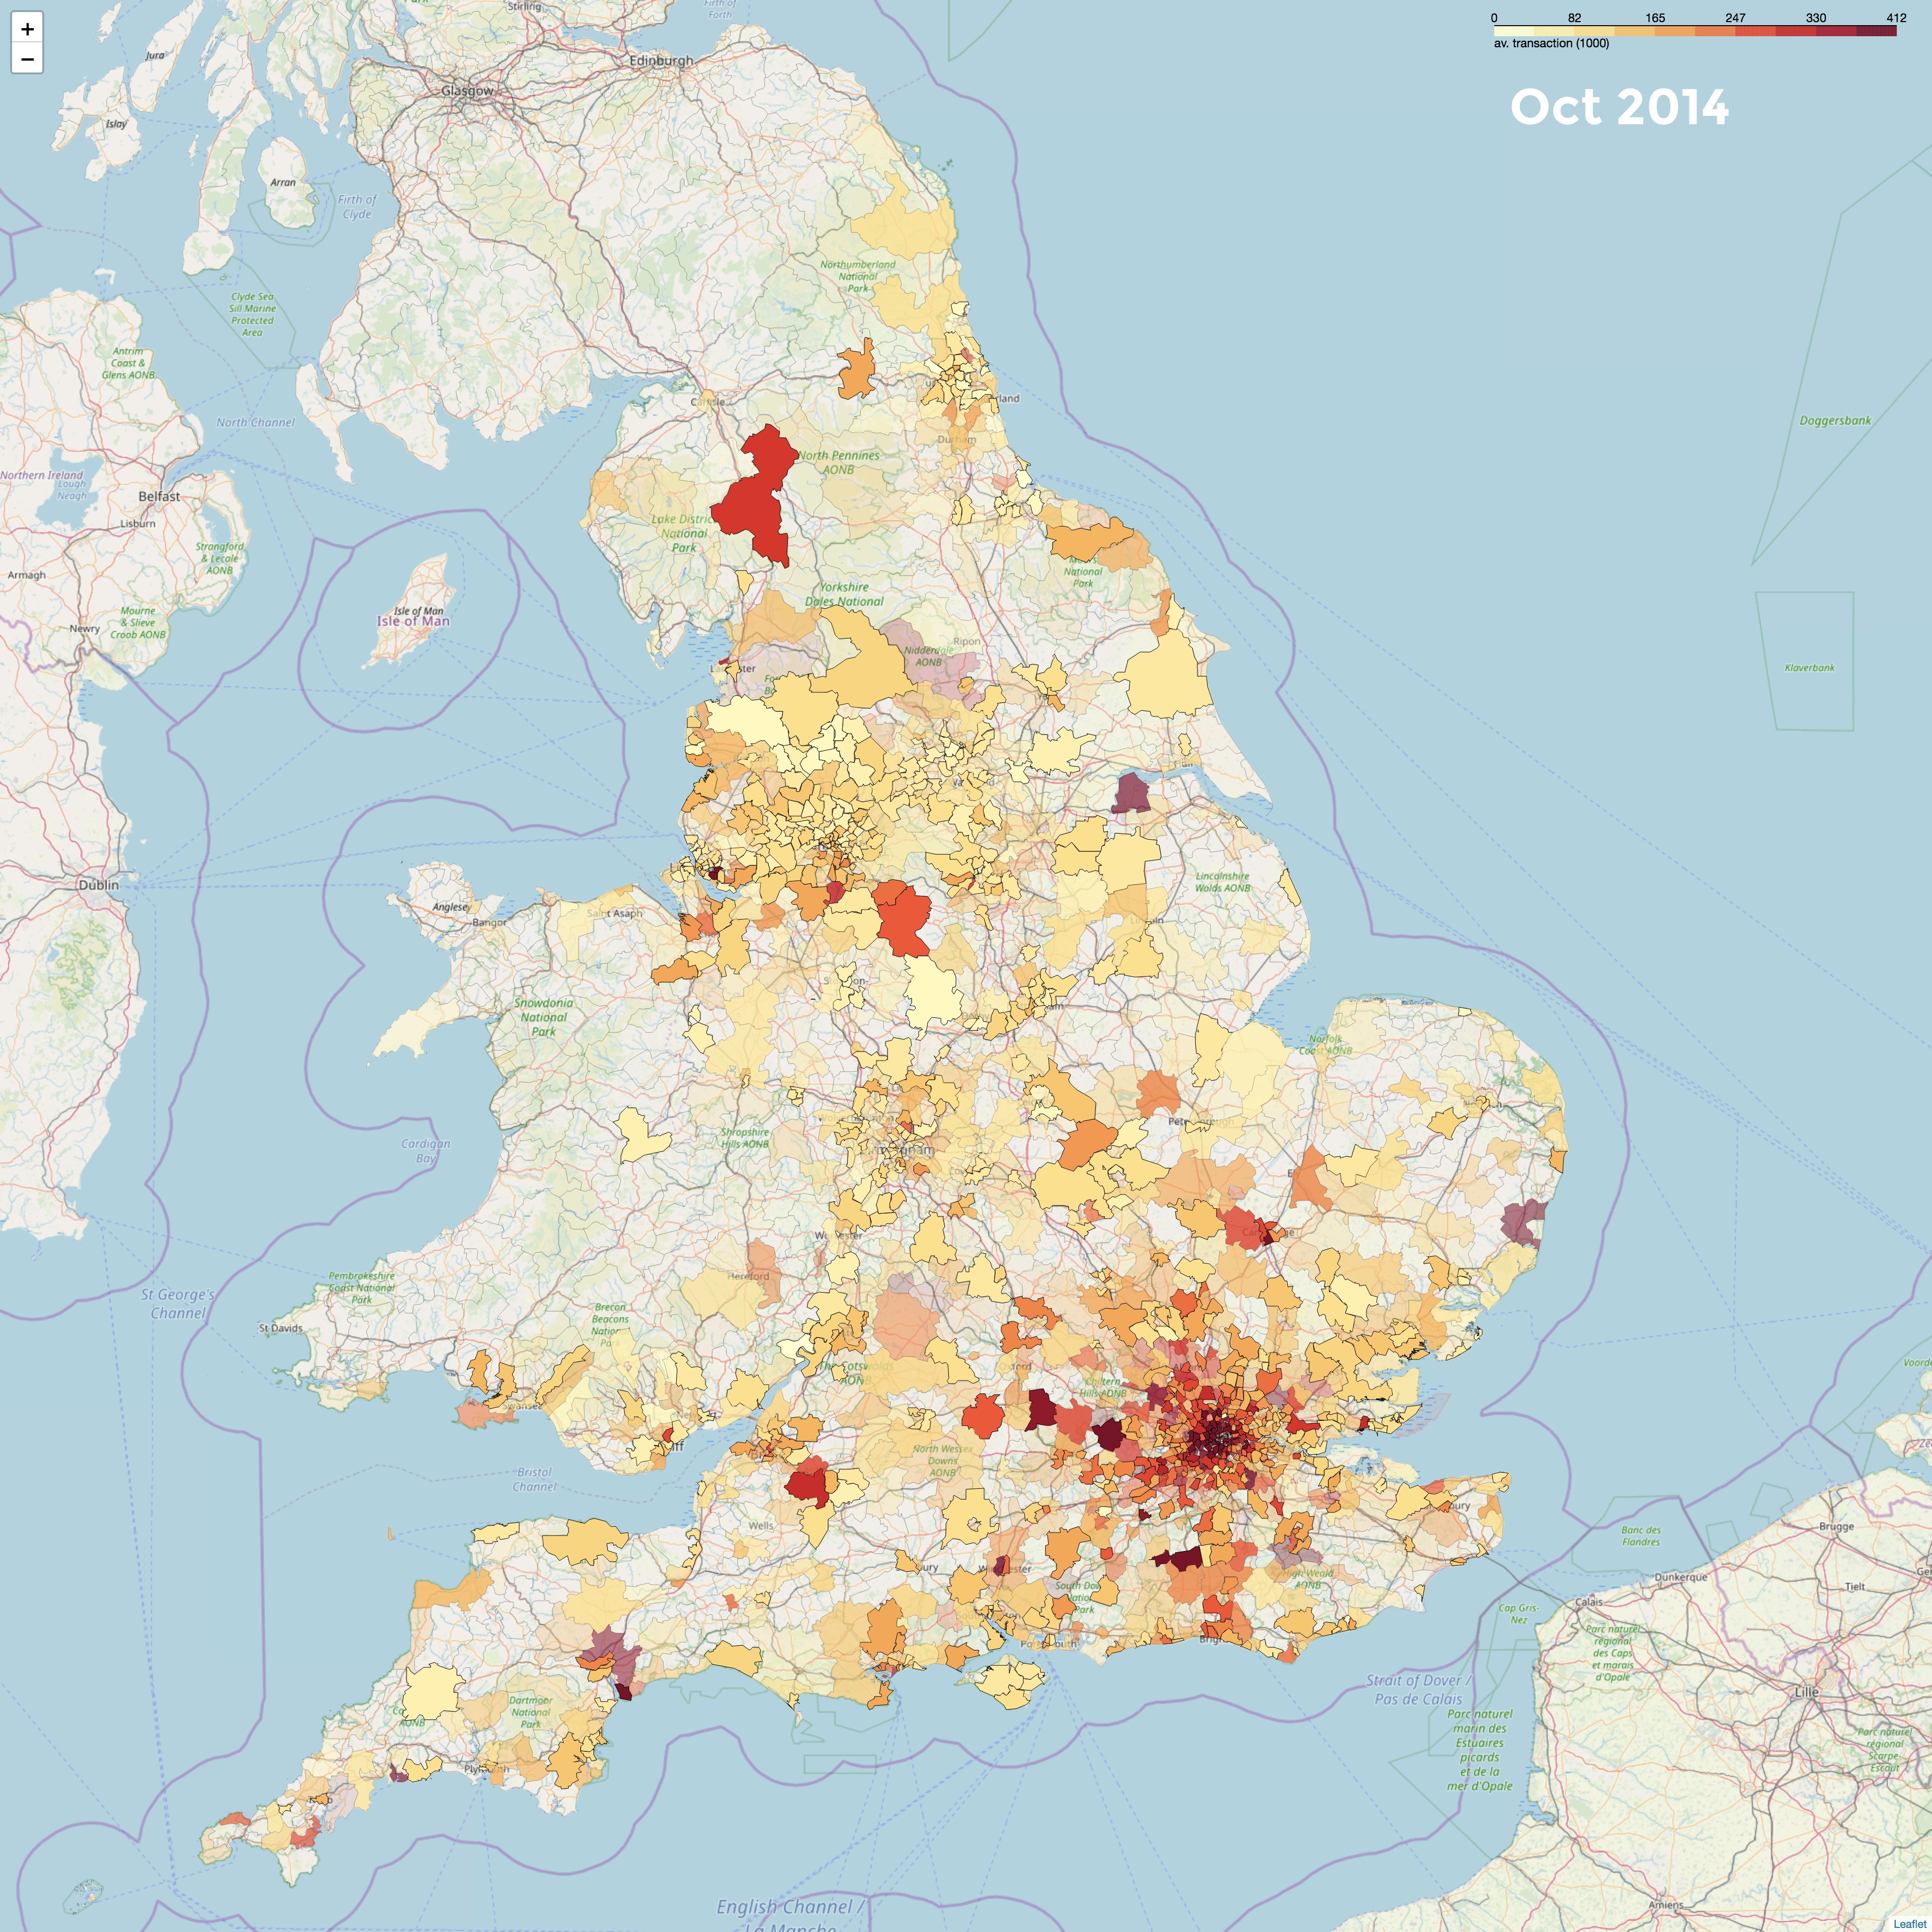
Our analysis shows a significant amount of movement in office rental prices over the last two years, particularly in the north. However these changes are not reflected on the map, demonstrating that longer term transaction values across all asset classes don’t follow that trend. This is likely due to the relative strength of offices when compared with other asset classes, such as retail.
When a recovery in rental prices isn’t accompanied by a similar uptick in long term lease or freehold sales, yields increase. This is to be expected, as the recent volatility means investors need higher returns to compensate for the higher perceived risk profile. Of course, this also means more opportunities for a savvy investor, where having the right tools to analyse the market and understand recent dynamics, as well as being able to pick the right entry points and geographical locations is critical.
HOW CAN THIS DATA BE USED?
For those wishing to understand the landscape of CRE properties the mapping visualisation of the data helps to bring to life trends, making it much easier to understand historic patterns. By plotting the average transaction values by area it becomes more apparent to investors and those with an interest in this data how the various areas interact with one another, allowing the identification of the cities which could present the next opportunity to take advantage of market dynamics.
WHAT ELSE CAN WE DO?
The mapping tool provides a snapshot into the type of projects our data science team work on to help organisations improve their investment decision making process. At present they are focused on fusing different data sets and looking into the relationship between them, including parallels between Land Registry and VOA data. By splitting out trends in different asset classes and visualising them as part of a geospatial analysis, our aim is to draw greater insights from the available data sets.
CRE data in the UK is pretty sparse and riddled with inconsistencies. Our products turn unstructured data into a structured form, enabling our clients to unlock their data. The Address Matching tool provides the largest backbone of addressable objects, with 4.4million more than UPRN, allowing us to pin address-based data sets to building internals, thus reflecting the complexities of the CRE market.
If you’ve got a property-based data conundrum our data science team can help. Contact us at enquiries@harnessproperty.com to find out more about our data science consultancy services.